Measure API capacity with controlled arrival rates
Application background
A team wants to know how many bookmark requests its API can handle before users wait too long. Imagine 120 requests arriving each second while the application can finish only 100. The unfinished work grows even if every individual request eventually succeeds.
A measurement tool can hide this problem if it waits for each response before sending more work. As the API slows, that tool sends fewer requests and no longer represents the original incoming demand.
Example walkthrough
| Action | Expected behavior |
|---|---|
| Offer 120 requests each second while capacity is 100 | Observe roughly 20 additional waiting requests per second under those assumptions. |
| The generator waits for responses and its sending rate falls | Report the reduced offered load instead of calling the service healthy. |
| Reduce demand below capacity | Observe whether the accumulated useful work drains. |
Offered load is what callers try to send. Completed throughput is what the service finishes. Record both, along with waiting time, rejection and errors.
Sizing that affects this decision
120 arrivals/s minus 100 completions/s adds roughly 20 waiting requests each second when nothing is rejected. After ten seconds, about 200 requests are waiting. Use an arrival model that preserves the stated 120/s demand instead of letting a slow response silently reduce the sending rate.
These are exercise assumptions. The estimation reference explains the units and approximations. They do not establish the local demo's measured capacity.
Your assignment
Deliver: Run one capacity experiment that records offered, accepted, completed and rejected work. Show waiting work and caller latency while demand rises and then recovers.
Required behavior: Report offered, admitted, completed, rejected and queued work separately under a stated arrival model. Measure generator headroom and client-observed latency including waiting. This is a one-off capacity exercise, not an added deployment check.
The primary deliverable is the report or operational procedure named above, backed by a reproducible local demonstration. Build the smallest supporting code needed to make that evidence visible.
Get the code and run the supplied example
The code is in the public junior-to-staff repository. Install Git and Python 3.12+. No AWS account or Python packages are required for this first run. If you already have a checkout, use it and skip cloning.
git clone https://github.com/Soulful-Iris/junior-to-staff.git
cd junior-to-staff
python3 examples/architecture-starts/04_the_load_test_that_finds_the_real_limit.py
Supplied file: examples/architecture-starts/04_the_load_test_that_finds_the_real_limit.py. You can also read or download the source here (download file, source below).
Read the supplied code · 04_the_load_test_that_finds_the_real_limit.py
"""Local mechanism demonstration for 04-the-load-test-that-finds-the-real-limit. No AWS resources are created."""
queue=0; arrivals=completed=0
for second in range(10):
    arrivals+=120; queue+=120
    done=min(100,queue); queue-=done; completed+=done
print({'arrivals':arrivals,'completed':completed,'waiting':queue})
print('A closed-loop generator changes offered rate when responses slow.')
This program is a mechanism demonstration: it runs the small scenario in one process and prints the result. It is not an HTTP service, a complete application, or an AWS deployment. A successful run demonstrates this mechanism only. It does not establish the workload or failure guarantees of the application you will build.
Example output from the supplied run:
Generated IDs and timestamps may differ. Compare the state transitions and outcomes.
{'arrivals': 1200, 'completed': 1000, 'waiting': 200}
A closed-loop generator changes offered rate when responses slow.
Set up your implementation workspace
Create work/04-the-load-test-that-finds-the-real-limit/ in your checkout (or use a separate repository). Copy the supplied mechanism into that directory as mechanism.py, then extract its state transitions into functions you can call from your implementation. The record and module names below describe what you must implement. They are not a promise that files with those names already exist. Keep a README.md beside your implementation with its exact run commands and observed results.
Local components and state to implement
This table names the records, interfaces or decision inputs for your deliverable. Unless a name is explicitly linked to supplied source above, it is something you create. Implement the local state transitions first, then connect the HTTP, storage or worker boundaries required by the steps.
| Record / module | Key or interface | Responsibility |
|---|---|---|
| arrival_schedule | planned_at,request_id,tenant_class | Independent offered workload. |
| request_result | sent_at,finished_at,status | Client-visible latency and outcome. |
| capacity_report | offered,completed,backlog,p99,resource | Reproducible workload and constraining dependency. |
Implement the assignment
1. Build a controlled arrival schedule
Choose fixed or randomized open-loop arrivals with a seed and bounded run duration. Record planned and actual send times so generator delay is visible. Use a disposable service environment and synthetic identities.
2. Find the first saturation point
Increase offered rate in short steps while observing completed throughput, queue age, CPU, pool waits and database work. Stop when the named operating limit is reached. A latency chart without arrival and completion rates cannot explain capacity.
3. Check the generator
Measure its CPU, sockets and scheduling lag. Add a second generator only to resolve suspected client saturation. Compare the same workload and verify that combined actual offered rate matches the plan before attributing a limit to the application.
4. Measure fairness and recovery
Repeat with one hot tenant producing 90% of requests. Record class-specific admission and latency. Stop arrivals and observe drain time. An apparently fast service with a large hidden queue is not recovered until that queue is handled or expired.
Demonstrate the completed local result
| Action | Expected visible result |
|---|---|
| Run the starting program | 1,200 arrive, 1,000 complete and 200 remain waiting. |
| Double a saturated generator | Offered rate changes. Reassess the previous conclusion. |
| Stop arrivals | Observe whether the backlog drains within the declared wait budget. |
Handoff: In your implementation README, include the start command, one successful operation, the failure case above and the resulting stored state or decision. State which dependencies are simulated. Someone with a fresh checkout should be able to reproduce this without your chat history.
Workload assumptions and capacity decisions
These are constructed exercise assumptions. The stated workload is a design target. The local demonstration does not establish that throughput. Use the estimation constants to check units before choosing capacity.
| Input or objective | Calculation / consequence |
|---|---|
| Open-loop 120 arrivals/s. 100 completions/s. Ten seconds | 1,200 arrivals, at most 1,000 completions and about 200 waiting absent shedding. |
| Closed-loop 100 users with one-second service | Offered rate adapts to response time. It does not maintain the same external arrival schedule. |
| Generator initially tops out at 80/s | Doubling generators may reveal that the earlier limit belonged to the client, not the service. |
Map the local implementation to AWS
Deployment status: local only. Running the supplied command creates no AWS resources and configures no cloud connections. The diagram is a proposed deployment of the completed application. Each box needs either a deployed runtime, a provisioned service or an explicitly external dependency.
Read the diagram by following the arrows from the entry point: application code accepts the request or event, the state owner commits it, and any worker produces the later result. The table ties those roles to code and adapter work. Multiple boxes do not imply multiple Python files already exist.
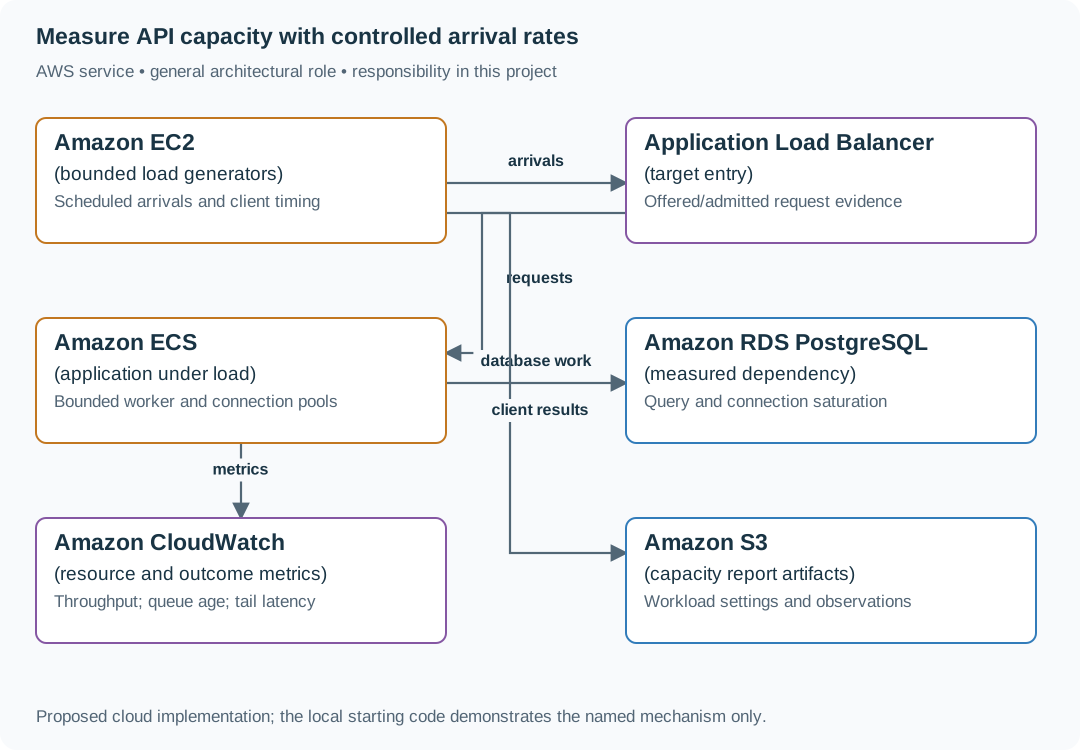
The generator is part of the measurement system and can be the bottleneck. Separating its evidence from server metrics prevents a client limit from being reported as service capacity.
| Local responsibility | Cloud destination and role | Implementation still required |
|---|---|---|
| Local process or worker model | Amazon EC2: bounded load generators | Provision isolated hosts, package the runtime and implement lifecycle/resource limits. A local simulation is not a hostile-code sandbox. |
| Local HTTP listener | Application Load Balancer: target entry | Deploy a service behind a target group, configure health checks and bounded connection/request behavior. |
| Application or worker process | Amazon ECS: application under load | Build a container and task definition. Supply configuration, task roles and graceful shutdown behavior. |
| Local records and transaction boundary | Amazon RDS PostgreSQL: measured dependency | Write PostgreSQL schema/migrations and a database adapter. Configure credentials, connection limits and recovery. |
| Local counters, timestamps and diagnostic output | Amazon CloudWatch: resource and outcome metrics | Emit bounded metrics and logs, build the named operational view and configure retention and access. |
| Local file, object fixture or exported payload | Amazon S3: capacity report artifacts | Implement upload/download and metadata adapters, scoped access, object naming, retention and incomplete-upload cleanup. |
Provision resources, then connect the application
| Resource or boundary | Initial configuration and reason |
|---|---|
| Scope | Isolated target, finite duration and explicit stop threshold. No background recurring workload is added. |
| Generator | Sufficient CPU/network headroom and recorded scheduling delay. |
| Target | Known instance counts, connection limits and dataset size so results can be interpreted and repeated. |
Use one disposable AWS environment for the cloud exercise. Put the named resources in infra/template.yaml or your existing IaC tool, pass resource IDs through configuration, and scope each runtime role to its own tables, buckets and queues. The diagram is a design to implement. It is not a claim that these resources have been deployed. Record the commands you used to deploy and remove the exercise resources.
For concrete provisioning commands, configuration wiring and cleanup, use the AWS foundation guide. It includes a deployable table/queue/object-storage foundation and explains which application and service adapters you still implement.
A provisioned queue or table does not make the local program use it. Configure resource IDs in the deployed runtime, replace the local adapter, and replay the same successful and failing operation against that runtime. Record the deployed commit and observable result, then remove the disposable resources using your infrastructure tool.
Extend the design after the baseline works
Use a realistic distribution of request costs rather than one cheap endpoint. Weight the workload by user behavior and report which route or tenant class consumes the limiting resource.
Follow-up scenarios and worked designs
Follow-up 1 · The generator saturates
Doubling generators raises measured service throughput from 80/s to 100/s. What was the earlier limit?
Worked design and implementation
The earlier result included generator capacity. Measure generator CPU, sockets and offered rate, then rerun with enough headroom. Do not label 80/s an application limit.
Separate offered load from completed work. Record intended arrivals, actual sends, accepted requests and completed requests using the same interval. Also record generator CPU and connection limits. If one generator cannot send more than 80/s, the service has not been challenged above 80/s.
Run the bounded exercise with enough generator headroom to sustain the target arrival pattern, then identify whether queue delay grows in the generator or service. Hand over a table of those four rates. More generators are justified by measurement, not by assuming the first bottleneck belongs to the API.
Follow-up 2 · Only one tenant is hot
One tenant produces 90% of traffic. Does a global average show everyone’s experience?
Worked design and implementation
Split latency, errors and admission by bounded tenant class, and test fairness. Use a concurrency/rate budget at admission to keep one hot tenant from consuming all downstream work.
Add fairness at admission. Split a controlled workload into a hot tenant and ordinary tenants. Use bounded tenant classes for aggregate metrics and detailed tenant IDs only in scoped diagnostic records. Give each tenant a concurrency allowance and keep the sum within downstream capacity.
Show the ordinary class's p95 and rejection count before and after one tenant generates 90% of arrivals. A global improvement can hide starvation of the smaller group. Your implementation change is the admission boundary and allocation policy, not merely another dashboard.
Revised flow. These are proposed components to implement, not extra services started by the supplied demo.
