Use logs, metrics and traces to explain one slow request
Project connection · feeds Reading-list stage 2: operate and recover the application
What the user did and what support needs to find
Ana clicks Save in a shared reading list. The browser waits 1.2 seconds before displaying the new bookmark. Ben saves another link at nearly the same time and gets a quick response. Support needs to find Ana’s operation among all the requests handled during that minute, then identify where her time went.
The application has three useful forms of evidence. A metric counts many operations, such as saves per second. A trace records related timed steps within an operation. A structured log records an event with named fields that can be searched. None automatically includes the others.
Start with an event you can read
This is an illustrative log shape to implement, not output already emitted by the starter:
{"event":"bookmark.saved","request_id":"req-ana-17","bookmark_id":42,"duration_ms":1200,"outcome":"created","service_version":"b17"}
Support can search request_id=req-ana-17 without searching for Ana’s raw URL, which may contain a private token. The request identifier should come from a trusted boundary or be validated there. The response must expose the identifier support asks the user to provide.
Your task is to choose and connect enough evidence to explain a slow save. Start with Trace requests through a bookmark API, which explains the local implementation and its AWS mapping. The broader lesson below adds population metrics, collection, sampling, and their costs.
Separate the request’s elapsed time into useful spans
“A customer's save takes 1.2 seconds, while the overall dashboard is green. You cannot reproduce it locally. What must already be recorded to locate the delay without adding a new log and waiting for it to happen again?”
You need evidence connecting one operation across boundaries. A metric counts events; a trace connects timed work; a log records a particular event's context.
| Teaching trace | Measured duration |
|---|---|
| Whole save request | 1,200 ms |
| Authorization | 30 ms |
| Database span | 1,050 ms |
| Other work and gaps | 120 ms |
Ask first: is the database time execution, connection waiting, or both? Nested spans overlap; adding every span duration can double-count wall time.

Investigate with evidence
- Find one affected request ID and its trace. A population average cannot explain why this particular request waited.
- Separate connection acquisition from query execution. That distinction changes whether you investigate pool saturation or a query plan.
- Correlate a safe tenant identifier, query fingerprint, version, and outcome. Avoid secrets and uncontrolled identifiers in metric label dimensions.
- Confirm the hypothesis on another slow trace, then compare after a change. A faster isolated sample is weak evidence without a comparable workload.
“Only one service propagates the trace ID.” Show the missing relationship, then repair context propagation across the queue boundary.
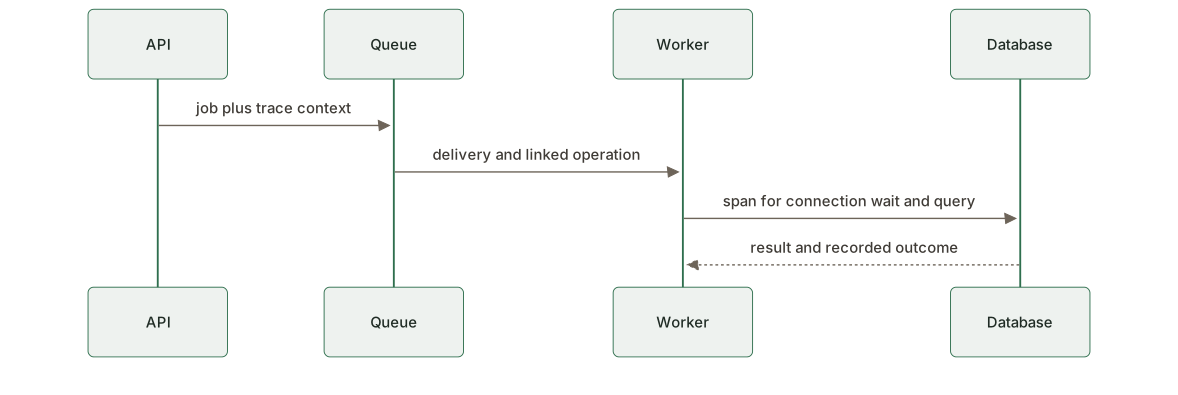
Explain sampling loss, cardinality cost, and retention before declaring the system observable. A lead also decides which team owns a broken telemetry link and how useful evidence remains available during an incident.
The principle behind the design
Monitoring answers the questions you thought of in advance: is it up, is it slow, is the disk full. Observability is answering the question you did not think of — at 3am, from evidence the system already recorded, without shipping new code first. The skill is choosing what to record, and at what cost, so one failing request can be explained after the fact.
Follow the failure through the system
A user writes in: "saving has failed for me all week." Every dashboard is green. The error-rate chart shows 0.4%, which is normal, because it is an average over everyone and she is one person.
The logs contain save failed three thousand times, with no user id and no
request id, so you cannot say which are hers or what happened just before each
one. The save path calls another service; there is no trace, so that hop's time
is invisible inside the total.
Four hours of ssh and grep later: past a certain account size one query flips to a bad plan, on one replica only. Nothing was unknowable — the system knew which requests were hers and how long each hop took. It never wrote it down in a form that could be asked.
The same day with observability: search traces for her user id, open the slowest, see one span holding nine of the ten seconds, read the query from its attributes. Ten minutes, no ssh.
Dashboards answer questions someone asked in advance. Users generate new ones.
Mechanisms and their limits
Known questions and new ones
Monitoring is a fixed set of questions asked continuously, alerts wired to the answers. You need it; it is how you learn that something is wrong. Observability is a property of what you record: can it answer questions nobody anticipated — why, for whom, since when? The test: can you explain the last weird thing one user experienced without shipping new code to find out? If every incident starts with adding a log line, you have monitoring.
Three signals, and where each one lies
Metrics are numbers aggregated over time: cheap, fast, the thing you alert on. They lie by aggregation — the mean hides the p99, and pre-aggregation throws the individuals away at write time, so no metric can tell you which request was slow.
Logs are events with detail — but only the detail someone thought to write, and without a shared id a log line is a diary entry: true, timestamped, about somebody, difficult to correlate. Use structured fields and the active trace/span IDs when there is a request context. Lifecycle events such as startup have no request: record service, instance, version and event, not an invented trace ID.
Traces follow one request across services as a tree of timed spans — the answer to "where did the time go" for a single request. They lie by absence: sampling may have dropped the one you need, and an uninstrumented hop is a gap blamed on the caller. A trace nobody propagated across a boundary is two traces, silent about the boundary — where the problem usually is.
Keep instrumentation separate from its destination
Use stable semantic attributes and propagate trace context across boundaries. An OpenTelemetry-compatible instrumentation layer and collector can separate application instrumentation from telemetry backends. Check the specific language, signal, and exporter support you need; one component's maturity does not prove that every integration is ready. Vendor-specific capabilities may still be useful when their benefits justify the coupling. Demonstrate the context and export path with a real request rather than relying on a project's maturity label.
The cardinality trap
A metric is not one thing in storage. It is one time series per combination of label values actually observed. Multiplying each label’s possible values gives a potential Cartesian-product bound, not necessarily the active count. For example, 4 methods × 20 routes × 5 status classes is at most 400 combinations; if only 63 combinations occur in the active window, observe 63, not 400.
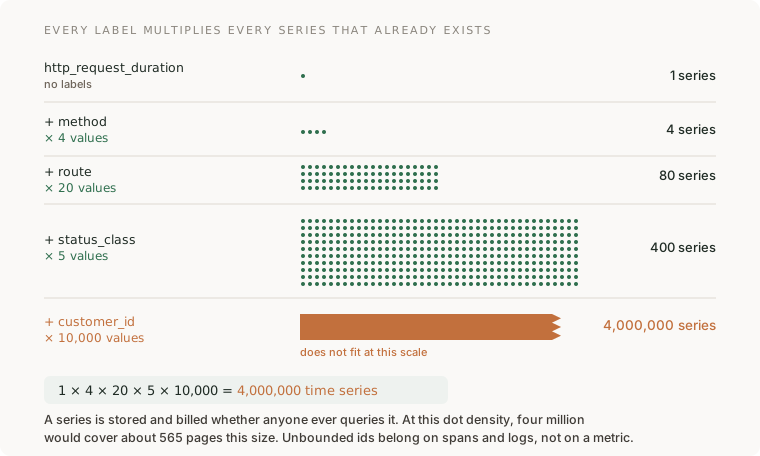
Metric storage cost depends on active series, sample frequency, retention, and the backend’s billing model. Adding a label can multiply series even when traffic is unchanged. Metric labels are for bounded dimensions you group by: method, route, status class. Anything unbounded — user ID, request ID, raw URL — must not become an unbounded metric dimension. Where diagnosis justifies it, use permitted pseudonymous identifiers on spans/logs with explicit indexing, access, sampling and retention controls. Never record secrets; strip sensitive URL parameters. Diagnostic attributes have a storage/query cost too, but do not automatically create one metric series per ID.
The counter-argument, wide events ("observability 2.0"): one wide structured event per request, dozens of fields, in a columnar store; metrics and traces derived at query time; cardinality becomes the point rather than the trap. Contested — pre-aggregated metrics remain the cheapest always-on alerting, wide events keep the individuals, many teams run both. Not contested: unbounded labels on a metrics backend is an invoice.
Sampling, and the part nobody teaches
At some volumes and retention targets, keeping every trace exceeds the available budget. Head sampling decides at the start: cheap, stateless, blind — the errors have not happened yet. Tail sampling decides once the trace is complete: attempt to keep traces containing errors, those over the latency target, and a sample of the rest. Late spans, buffering limits, and collection failures can still lose evidence. This example policy has two consequences:
- Tail sampling is stateful: the decision needs the whole trace, so every span with the same trace id must reach the same collector instance or traces fragment. A common topology uses two layers — a stateless layer load-balancing by trace id, then a layer buffering complete traces and applying the policy. The policy without the routing layer looks fine until there is a second collector.
- Keep request metrics independent of biased trace retention. A tail policy that favors errors changes the proportions in the retained traces. Error rate, throughput and latency derived only from those survivors can misrepresent the service. Record request counters and duration histograms independently, or compute span metrics before trace sampling from an otherwise complete span stream. If SDK head sampling already discarded spans, moving a span-metrics processor before tail sampling cannot recover those missing observations.
Where to point it
The request at the edge: rate, errors, duration. Every dependency call — timeouts, retries and mystery gaps live there. The queue: depth and age of the oldest item; a three-item queue looks healthy while its oldest has been stuck forty minutes. And the thing users feel — "link added until title visible" — the user's unit of work, not your process.
What good looks like
- Every operation has a queryable causal path: trace parent/child relations or links, stable message/operation IDs, and structured logs with active context.
- From an alert to the traces to one request's logs in a few clicks; no ssh in the incident story.
- Application code imports only the OpenTelemetry API; the vendor is named in one config file.
- Someone can state the active-series count, and every custom metric's labels are enumerated with their value counts.
- The sampling policy is written down: what is always kept, what fraction of the rest, where the decision happens.
- The telemetry bill is a reviewed line item, and the top three costs can be attributed to named metrics or log streams.
Done badly:
- Dashboards green during an outage users can feel.
- Logs as prose — "something went wrong in handler" — no ids, no fields.
user_idas a metric label. The bill doubles overnight, or the vendor drops series at a limit and the charts develop quiet holes.- Traces that end at every service boundary, so each downstream call is a mystery gap attributed to the wrong team.
- Alerts on causes (CPU high) rather than symptoms (users waiting): the pager fires for what nobody feels and sleeps through what everybody does.
Use an assistant to investigate specific questions
Request 1 — instrument a service, with the cardinality conversation forced
Instrument this service with OpenTelemetry: traces, metrics, logs.

Rules:
- Application code imports the OpenTelemetry API only. No vendor
  SDK outside one exporter config file.
- Propagate trace context across every boundary: inbound HTTP,
  outbound HTTP, the database, the queue in both directions.
- Logs are structured; include active trace/span IDs when present, otherwise
  service/instance/event fields. Preserve message IDs and causal span links.
- List every metric you created with its labels, and for each
  label the number of possible values. Flag anything unbounded.

Then show me one request's story end to end: its trace, its spans,
and the logs reached through its trace IDs, links and operation/message IDs.
Why it is asked that way: the API-only rule keeps instrumentation portable, and it is the rule generated code breaks first. Label enumeration forces the cardinality conversation before the first deploy rather than on the first invoice. "One request's story" is the acceptance test: the point is following one request, so make the work demonstrate it.
What you should get back: a service where the queue consumer's spans share or link to the producer's trace id. That hop is the one automatic instrumentation misses most: the context must ride inside the message.
Push back on: unbounded metric labels; diagnostic fields without privacy and retention controls; request errors without correlation; a hand-rolled "portability wrapper" around a vendor SDK — the vendor SDK with extra steps.
Request 2 — a tail-sampling design that must show its topology
Design tail sampling for this system at <N> requests/second.
Policy: keep 100% of traces containing an error, 100% slower than
<threshold>, 1% of the rest.

Show the collector topology as configuration, not prose. The
policy needs every span of a trace in one place: show how spans
reach the same collector instance when there are three collectors,
and what happens to in-flight traces when one restarts.

State where request rate, error rate and latency metrics are
computed, and why the sampling decision cannot bias them.
Why: "configuration, not prose", because the failure lives in the topology and prose happily describes a single collector as if it scaled. The restart question surfaces the statefulness; the metrics paragraph is the span-metrics trap made explicit.
What you should get back: two layers — stateless routing by trace id, then the tail sampler — metrics computed before the sampler, and an honest note that a restarting collector loses what it was buffering. One collector plus "scale horizontally later" is the wrong answer looking reasonable: it cannot, without the routing layer.
How you would know it is wrong
- Run the fire drill. Someone breaks one thing on purpose — hangs a dependency, slows one query, poisons one queue message — and you time yourself finding it from telemetry alone. No ssh, no grepping boxes. Ten minutes is a pass. If the answer came from anywhere but your instruments, they failed, whatever the dashboards say.
- Count your active time series. If nobody knows the number, look it up — use the backend’s available series inventory or an estimate with its limits stated. Add one label to one metric, predict the new count, check. Unable to predict means you do not control the bill; off by 10x means the label was not bounded.
- Follow causality across the queue. Test a single message, a batch from two different producer traces, and a delayed consumer. Use a parent where appropriate and span links for multi-parent/asynchronous work. Navigate from the consumer log to each originating operation without merging unrelated requests into one trace. A lifecycle log needs no request trace.
- Check a dashboard rate against the unsampled truth. Compare the dashboard's error rate with the raw pre-sampling error count for the same hour. Divergence means metrics are computed after the sampler, and every rate on that dashboard pictures your sampling policy, not your traffic.
- Attribute the bill. Tie the top three telemetry costs to named metrics or log streams. If you cannot, that is not a budget, it is a leak with a monthly statement.
Apply this lesson to the reading-list application
On P2, the reading list from P1 gets instrumented — the "can you fix it at 3am" half of that project's question.
- OpenTelemetry tracing on inbound requests, database calls, the outbound URL fetch, and the deferred title-fetch path in both directions.
- Structured logs with active trace/span context or lifecycle identity; message IDs and span links preserve asynchronous causality.
- Metrics for rate, errors and duration by route and status class, plus queue depth and the age of the oldest pending fetch.
- A written sampling policy. At your volume it may honestly be "keep everything" — write down why, and the number at which that stops being true.
- A series inventory: every custom metric, its labels, their value counts, the total.
Acceptance criteria:
- The fire drill passes: someone picks one of three planned failures (kill the database, hang the fetch, stall the queue) without telling you which, and you name it from telemetry alone in under ten minutes.
- Any failed fetch in the UI can be turned into its trace and logs by id, in one search.
- Break propagation on purpose — drop the traceparent header on one hop — and watch the trace split in two: proof you can tell propagation from coincidence.
- You can state your active series count, and predict what adding
tagas a label to the request metric would do to it.
Terms used in this lesson
- observability — enough recorded detail to answer questions you did not anticipate.
- time series — one stored stream per combination of metric name and label values.
- cardinality — how many distinct values a label has. The multiplier.
- structured log — an event as keys and values, not prose, so it can be queried.
- correlation id — a stable identifier used to connect related events; an operation may span several linked traces.
- span — one timed operation; a trace is the tree of spans for one request.
- context propagation — carrying causal context across boundaries; parent/child relations and span links represent different relationships.
- head sampling — keep-or-drop decided at trace start. Cheap, blind to outcome.
- tail sampling — a stateful decision after a buffering window. A keep-error policy still depends on spans arriving within that window and capacity limits.
- wide event — one rich event per request; metrics and traces derived at query time.
what to do when telemetry says something is wrong — SLOs, error budgets, alerting, on-call — belongs to reliability; this section is about being able to see. Continuous profiling is a separate measurement technique. Front-end and real-user monitoring have their own tooling. Audit records have additional integrity, access, and retention requirements. Diagnostic logging alone may not meet that contract.
Draw it from memory · Connect evidence without exploding cardinality

A 202 response succeeds but no job completes. Which signal detects the user-visible failure?